This is by way of being a "guest blog". Following on from Erik Brenstrum's sterling efforts at analysing Ken Ring's work, we have the work of one of NIWA's senior scientists, Jim Renwick, who for his own interest (and in his own time) looked at the maps in Ken's almanac for 2005 and compared them with reality:
"Since I have all the maps for the last 40 years in electronic form, it was easy for me to score his daily weather maps against reality for all of last year. His scores were slightly worse than those obtained by picking maps at random. Allowing him one day's grace (i.e. choosing the best score from verifying against yesterday, today, and tomorrow's actual outcome) made things slightly better, but still didn't beat the random forecast when it was also given one day's grace."
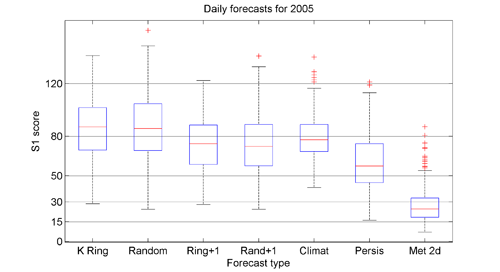
"The first uses what are called by forecasters "S1 scores". They are a measure of the relative error in the forecast pressure map (actually the errors in the pressure differences, or implied winds), as a percentage. So, they are like golf scores, the lower the better, with zero being absolutely perfect. In practice, a score of less than 30 is considered so good as to be almost perfect for forecasting purposes. A score of more than 80 is considered useless for forecasting the actual weather.
Each set of results is shown as a box plot, where the red line shows the median of the daily scores, the box extent shows the range of scores from the 25 percentile to the 75 percentile (i.e. the range that the middle 50% of the scores lie within) and the "error bars" show the 95% interval. Any red plus signs are "outliers" beyond the "error bar" limits.
I have scored the Moon forecasts (labelled "K Ring") and compared with various other methods. The first is with forecast maps chosen at random from the past 40 years (labelled "Random") - they are selected to be within 10 days of the DATE we're interested in, but can be from any year. This is to match Ken's 18yr+10day offset, and keeps the seasonality OK. Then, I allow the moon forecasts 1 day's grace either side ("Ring+1") and the same for random ("Rand+1"). I also calculated scores for "climatology" i.e. using the average maps for the time of year (labelled "Climat"), and for "persistence", i.e. using yesterday's map as the forecast for today (labelled "Persis"). Finally, I obtained the MetService's two-day-ahead forecasts for the year of 2005 and scored those, as in the last column labelled "Met 2d".
You can see that the Moon forecasts have a median score about 85 (useless). About two thirds of the moon forecasts score over 80, in the "useless" category, and about 1% are in the less than 30 "perfect" category. The random forecasts do about the same - identically in a statistical sense. If we allow one day's grace, both sets of scores improve about the same amount, so now only one third are useless and 2% are perfect. The climatology forecasts are in between the straight moon forecasts and the 1-day's-grace moon forecasts. Persistence is way better, with almost no "useless" forecasts. The best by far are the Met Service two-day forecasts (and one-day ones are better again, of course), where only two of the 365 forecasts are "useless" (about 1%) and about two thirds are "perfect", the reverse of the moon forecast situation."
Thanks Jim!
In other words, the weather maps in Ken's almanac for 2005 were - as tools for weather forecasting - statistically identical with maps selected at random from the same time of year over the last 40 years. Give him "the day either side" he claims to need, and his work is still no better than picking maps at random. A picture is beginning to emerge. From my analysis of rainfall and sunshine, from Erick Brenstrum's analysis of his forecasts and Jim Renwick's scoring of his weather maps, Ken's system of weather forecasting does no better than random guesswork. Even the easiest forecast in the world - tomorrow will be like today - does better than the Ring method.
I wonder how he calculates his "80% success rate"?
.jpg)


