September 06

Ken is reluctant to give up his claim to have forecast the flooding in the Wairarapa in early July (see Skinhead Moonstomp below). Over at the NZ Climate Science Coalition, he posted the following (on Sept 14) when pressed to justify his claim:

"p214 For July..Districts likely to be wetter..Wanganui..north of Wairarapa.. p216..July 8th: south of Taranaki galeforce winds and more frequent showers.. p217..9th-12th..depression crosses NZ, snow central high country NI, clearing 13th. p40: flooding August 3 lower NI. Sept 12: flooding Hawkes Bay and Wairarapa. Absolutely correct. Anyone with half an honest brain will be able to work out from that that the lower NI was in for a belting, not on the east, which did remain fairly dry, but inland and central areas of the lower NI."

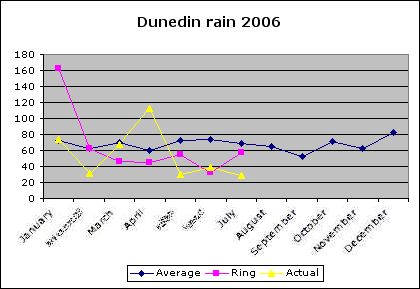
Let's recall, for a second, that the floods in the Wairarapa took place over July 4-6th. Apparently forecasting floods in August and September counts as a forecast for the first week in July.

Unfortunately, Ken remains in denial. On the 21st he posted:

"And I told you I predicted the heavy rain. I am rapidly losing patience with your lies. In the July column in syndicated rural magazines across the country, found in every dairy, I said: "..rain above average north of Wairarapa. Most likely rainfall times lower NI about 1st-5th and 9th-12th, heaviest 10th." That indicates plenty of rain in the first 12 days. The Metservice report of the 17 July reiterates: "The southeastern end of the North Island has been taking the brunt of the recent rain", commented MetService Weather Ambassador, Bob McDavitt.
On p42 of my almanac, for August, I wrote "in the first week very heavy rain is expected in the NI, especially Manawhatu." And in my August column, in all magazines: "lower NI could see floods." And the Metservice report of 5 Aug again reiterates: "MetService meteorologists have updated their warning for heavy rain in Northland, Auckland, Coromandel, Bay of Plenty and the Gisborne area north of Tolaga Bay as a multi-centred area of low-pressure from the subtropics continues to rapidly deepen in the north Tasman Sea. This system is forecast to move southeastwards across northern and central parts of the country on Monday, preceded by an increasing strong northeast flow containing unseasonably heavy bursts of rain. Rain on Sunday is also expected to become widespread over the rest of the north Island and northern parts of the South Island, especially to the northwest of Nelson. Places such as Wairarapa, Wellington and Wanganui with already saturated soils may get 30 to 50mm of rain."

It remains to be seen why he thinks that a forecast of rain in August is relevant to flooding in July. I pointed this out to him, only to get a most ill-tempered response.

"Take a good look at yourself and your actions. You of all people who cannot let others live and let live, who takes it upon himself to try to ruin the credibility and business of another just because he doesn't like the other's ideas and theories. You cannot claim I have tried to affect your business, but there is every piece of evidence on your nasty little blog to prove you are out to wreck mine. You are a Nazi, Gareth, and no less. You are displaying the very root of the type of scapegoatism that lead to the Holocaust."

Erick Brenstrum is a bully for daring to analyse Ring's almanac's forecasts, and I am a Nazi. If it wasn't risible, it would be an insult, and Ken would be in court. In the meantime, we have to conclude that his judgement of the success of his forecasts is no better than wishful thinking.

This is by way of being a "guest blog". Following on from Erik Brenstrum's sterling efforts at analysing Ken Ring's work, we have the work of one of NIWA's senior scientists, Jim Renwick, who for his own interest (and in his own time) looked at the maps in Ken's almanac for 2005 and compared them with reality:

"Since I have all the maps for the last 40 years in electronic form, it was easy for me to score his daily weather maps against reality for all of last year. His scores were slightly worse than those obtained by picking maps at random. Allowing him one day's grace (i.e. choosing the best score from verifying against yesterday, today, and tomorrow's actual outcome) made things slightly better, but still didn't beat the random forecast when it was also given one day's grace."
"The first uses what are called by forecasters "S1 scores". They are a measure of the relative error in the forecast pressure map (actually the errors in the pressure differences, or implied winds), as a percentage. So, they are like golf scores, the lower the better, with zero being absolutely perfect. In practice, a score of less than 30 is considered so good as to be almost perfect for forecasting purposes. A score of more than 80 is considered useless for forecasting the actual weather.
Each set of results is shown as a box plot, where the red line shows the median of the daily scores, the box extent shows the range of scores from the 25 percentile to the 75 percentile (i.e. the range that the middle 50% of the scores lie within) and the "error bars" show the 95% interval. Any red plus signs are "outliers" beyond the "error bar" limits.
I have scored the Moon forecasts (labelled "K Ring") and compared with various other methods. The first is with forecast maps chosen at random from the past 40 years (labelled "Random") - they are selected to be within 10 days of the DATE we're interested in, but can be from any year. This is to match Ken's 18yr+10day offset, and keeps the seasonality OK. Then, I allow the moon forecasts 1 day's grace either side ("Ring+1") and the same for random ("Rand+1"). I also calculated scores for "climatology" i.e. using the average maps for the time of year (labelled "Climat"), and for "persistence", i.e. using yesterday's map as the forecast for today (labelled "Persis"). Finally, I obtained the MetService's two-day-ahead forecasts for the year of 2005 and scored those, as in the last column labelled "Met 2d".
You can see that the Moon forecasts have a median score about 85 (useless). About two thirds of the moon forecasts score over 80, in the "useless" category, and about 1% are in the less than 30 "perfect" category. The random forecasts do about the same - identically in a statistical sense. If we allow one day's grace, both sets of scores improve about the same amount, so now only one third are useless and 2% are perfect. The climatology forecasts are in between the straight moon forecasts and the 1-day's-grace moon forecasts. Persistence is way better, with almost no "useless" forecasts. The best by far are the Met Service two-day forecasts (and one-day ones are better again, of course), where only two of the 365 forecasts are "useless" (about 1%) and about two thirds are "perfect", the reverse of the moon forecast situation."

Thanks Jim!

In other words, the weather maps in Ken's almanac for 2005 were - as tools for weather forecasting - statistically identical with maps selected at random from the same time of year over the last 40 years. Give him "the day either side" he claims to need, and his work is still no better than picking maps at random. A picture is beginning to emerge. From my analysis of rainfall and sunshine, from Erick Brenstrum's analysis of his forecasts and Jim Renwick's scoring of his weather maps, Ken's system of weather forecasting does no better than random guesswork. Even the easiest forecast in the world - tomorrow will be like today - does better than the Ring method.

I wonder how he calculates his "80% success rate"?

Ken Ring's "forecasts" have been subjected to some serious scrutiny beyond my own modest efforts. Erick Brenstrum of MetService (author of the excellent New Zealand Weather Book) writes regularly for NZ Geographic, and used his column in the May-June issue this year (#79) to look at how Ken's forecasts for 2005 performed. The piece is not available on the web, but Erick was kind enough to send me a copy, together with a letter from Ring and Erick's reply from the current issue (#81). It's a fascinating read...

Erick reveals that the weather maps that Ken prints in his almanac are those for 18 years and 10 days prior to the day in question. There is, I presume, a "lunar" reason for this. Ken has quite a few to play with...

"Weather maps will be seen to repeat on a simpler time frame, and I have used 6584 lunar days, 6726 lunar days and 6935 solar days in past almanacs. These cover 18-20 years. Anyone wishing to explore the cycles operating on their location should experiment with old rainfall or temperature data, finding a stand-out event and then checking back through their own records to find a matching standout event between 18-20 years ago. The cycle that emerges can then be used to project into the future. What works for one location will not necessarily work for another."

That may explain why they don't work at all. Erick analyses a number of common NZ weather systems - strong northwest winds preceding a front that brings heavy rain to the west coast, and lows that cross the country bringing rain to the east coast. In 2005 there were 22 of the former - none matched in Ken's maps - and 18 of the latter, of which Ken's map sequence got precisely one. Giving him his one day either side leeway doesn't make much difference.

Ken wasn't impressed with Erick's deconstruction of his forecasts. From NZ Geographic issue 81:

"Despite what he says, I can prove they work 85 per cent of the time."

And then, in what seems to be something of a meme for Ken, he accuses Brenstrum of bullying him by naming him. As Warren Judd, editor of NZ Geographic comments:

"...once you publish a book, you're fair game for public scrutiny of its content and your own competence."

I'm waiting for Ken to supply his proof of competence. I've been looking. I can't find it.

PS: Warren, could you put Erick's columns up on your site? It would be a service of national importance...

NIWA's climate summary for August is now available, and I've updated my spreadsheet (here). On both rainfall and sunshine, Ring gets two hits and two misses, so his city/month hit rate is still running at about 50%. Forecasting the long-term average would have done better than the moon method in August. I'll update the graphs and trends when we have another couple of months data, and do a roundup at the end of the year.

Meanwhile, over at the NZ Climate Science Coalition, Ken makes a telling admission:

"Okay, my work is very much astrological, which is the same as saying meteorological, because the astrologers invented meteorology. So does that mean now you'll leave it alone? I suspect not. It takes more than that to stop a playground bully."

I'm sure the notion that meteorology was invented by astrologers will come as news to historians of science. He seems to think that making any attempt to audit his forecasts amounts to bullying. Facing the facts can sometimes be difficult, but I don't think it amounts to bullying. And he admits, grudgingly, that his work is "astrological". But I don't expect to find that admission on his new almanac...

As I noted a couple of days ago, Ken is making some claims for this year's forecasts in his Ezine for Sept 3:

"We were quite happy to have gotten most events correct for the 2006 version. p41 lists 12 June "cold wintry blast brings snow to low levels in Canterbury..". We also got the timing of the formation of Cyclones Larry/Wati and Monica, the flooding in the Wairarapa, the good snow amounts at Whakapapa and the low levels in the southern hydrolakes."

Let's take a look at "the flooding in the Wairarapa" which he claims to have "gotten" correct. Over the three days from July 4th to 6th, the Wairarapa was wet. From the NIWA climate summary for July:

"High rainfall totalling 100 to 160 mm or more over 3-days occurred throughout Wairarapa, Wanganui, and Wellington during 4-6 July. This resulted in high rivers and severe surface flooding throughout much of southern Wairarapa, along with substantial landslips in parts of the Wanganui and Wellington regions. 100 mm was reported within 24 hours in parts of South Wairarapa, where people had to be evacuated from their homes. Martinborough was isolated by the floodwaters, and surface flooding also affected Greytown and Carterton. In Wairarapa, more than 50 roads were closed due to flooding or landslips."

I looked through Ring's almanac to see if I could find his successful prediction of these dramatic events. I started at the front. On p34 he gives his "season estimates". Nothing there. On p41, he gives his extreme weather warnings. Nothing there either. I flipped through to the chapter for July. The summary on p214 doesn't mention floods or heavy rain in the Wairarapa, and the daily summaries don't either. A bit further on (p227/8), his daily charts don't look anything like the weather charts for the period. He forecasts "showers in the north and east of of the North Island for the 4th, then it's fine and dry right through to July 8th. In early July, the only reference to any serious weather is in the summary for July 8th, where he mentions "gale force winds and more frequent showers" south of Taranaki. That paragraph also includes "in the east from Gisborne to the Wairarapa, dry with strong westerlies". There's nothing in his Ezine for the period either.

Try as I might, I could find no reference to heavy rain in the region within a week either side of the actual event. So how does Ring reckon he correctly forecast the Wairarapa floods? I don't know... Perhaps he'll tell us. In the meantime, I am forced to conclude that he is misleading us. I'm sure that this is not deliberate, and that he will correct his statement promptly. I'll be sure to provide an update when he does.

I'm not ploughing a lonely furrow in my examination of Ring's "forecasting". Apart from Bill Keir's dissection of the moon method, I've come across a couple of other web pages that put his forecasts under the microscope. I See Dumb People, an NZ site devoted to exposing scams, has an interesting page on Kenny and his forecasts. They're very strong on his ability to conjure accurate forecasts out of the most unpromising material in his almanac. And an Australian site, Second Sight, isn't too impressed with Ken either.

But Ken's not on his own, either. I've discovered that there are a few people who call themselves astrometeorologists who believe that the moon and stars can be a useful predictive tool. Here's an American example, WeatherSage, (there's a blog, too). And guess what? Ms WeatherSage has page of tributes to astrometeorologists - including Ken Ring. It's a small moon...

Good picture of the dog, and a nice piece in the Christchurch Press today (thanks Robyn).

"I am confident North Canterbury is a good place to grow because it has a warm, dry climate in the summer and a coolish winter, similar in many respects to the climates the black truffle is grown in in Europe," Renowden says. All New Zealand growers had to do was to produce enough not only to satisfy the local market, but also to get quality fresh truffles to northern hemisphere chefs."

All? Is that all?

From Ken Ring's Weather Ezine (Sept 3rd):

Sydney notes

September

Two weeks of dry weather with possible fogs to begin with. ... All in all, a nice month, no huge storms, no cyclones, good spring weather.

Daily:

September 4 Mon Partly cloudy, fine, warmer

September 5 Tue Fine, moderate breezes, fog potential

September 6 Wed Fine, mostly sunny, fog potential

September 7 Thu Fine, sunny

September 8 Fri Mainly fine, misty/fog patches

September 9 Sat Mainly fine, lowland fog patches possible, lazy winds

September 10 Sun Cloudy, threatening rain, mostly dry

From ABC News, September 7th:

Drenched Sydney braces for high winds

Wind gusts up to 95 kilometres an hour are expected to hit Sydney later today after a night of wild weather. Heavy rain and localised flash flooding has caused commuter chaos across the Sydney metropolitan area. A mudslide north of Wollongong has forced the closure of the south coast rail line between Scarborough and Waterfall....

The Bureau of Meteorology says 107 millimetres of rain has fallen in Sydney - the third-highest September daily rainfall total in history, and the highest since 1883. In the catchment area, Warragamba has received 47 millimetres of rain.

Another striking success for the Ring method.

[Apologies to anyone who's tried to download the spreadsheet - there was an issue with my file upload. Fixed now.]

The long term averages for monthly sunshine hours show an unsurprising pattern: highest in December/January, lowest in June. There aren't the big positive variances from the mean that we see in rainfall because there is a maximum limit - the day length. On the other hand, it's conceivable that a very cloudy month could have very low - even zero - hours of sunshine, but that would be much more likely (or easily achieved) in winter when days are shorter.

Auckland

Actual sunshine hours track the long term average through until June, which was much sunnier than normal. Ring's "estimates" are low in January, then follow the average through until June - which he therefore gets wrong. He also forecasts that July would be significantly duller than average, but it turned out to be sunnier.

Wellington

Ring's forecasts for the capital are right twice, in March and June. He gets February very wrong, and May and July are only slightly better.

Christchurch

Ring does well in January and July, and not badly in April, but the other months are all well wide of the mark. Since he reckons Christchurch is supposed to be drier than normal, that could explain why he predicted more sun than average from March through to July.

Dunedin

I was surprised to discover that Dunedin only averages 86 hours of sunshine in June (under 3 hours per day). Perhaps that's why the students there seem so fixated on burning sofas in the streets. Heat and light...

Ken is clearly convinced that Dunedin should be having a sunny year. He does well in June and July, and not too badly in January, but as the rest of the year tracks the long term average, he's way out.

So how many city/months can we give him? Being generous, I score him with four hits in Auckland, Wellington and Dunedin and three in Christchurch, for a total of 15 out of 28 - or about 54%. If he had simply predicted the long term average, he'd have been right four times in Wellington and Dunedin, five times in Christchurch, and six in Auckland for a total of 19, or 68%.

Ken's rain and sun forecasts are therefore "right" (or "close enough") about half the time, which is no better - and sometimes worse - than simply predicting that rain or sun in a given location will simply be the same as the long term average for that time. This is hardly a ringing endorsement of Ken's forecasting method, and certainly a long way short of the 80% to 85% accuracy he claims.

Next: how good is Ken at forecasting newsworthy weather events? He claims (Weather Ezine, Sept 3):

"We were quite happy to have gotten most events correct for the 2006 version. p41 lists 12 June "cold wintry blast brings snow to low levels in Canterbury..". We also got the timing of the formation of Cyclones Larry/Wati and Monica, the flooding in the Wairarapa, the good snow amounts at Whakapapa and the low levels in the southern hydrolakes."

Most events? More than half? The flooding in the Wairarapa? Digging into that will provide an interesting perspective on his forecast techniques...

Ken's "estimates" for rainfall and sunshine hours appear in tables at the beginning of each month's section of the almanac. I sourced figures for the actual rainfall and sunshine hours from the National Institute for Water and Atmospheric Research's (NIWA) monthly climate summaries, available here. These are published by NIWA a week or two after the month in question, and provide a good overview of the weather we experienced - details of severe weather events, record temperatures, rainfall, snowfall etc. NIWA provide summary rainfall and sunshine figures for NZ's main centres, and I chose to use four of them for the comparison - Auckland, Wellington, Christchurch and Dunedin. I also downloaded NIWA's climate figures for rainfall and sunshine as a basis for comparison. All the data was entered into an Excel spreadsheet, available here [Excel (.xls) spreadsheet]. The current version includes data for January to July 2006, and I'll update it as subsequent months become available.

Auckland rainfall

All the data for this graph (and all subsequent graphs) is available in the Excel spreadsheet linked above. The "average" is the climate data for the period 1971-2000 (NIWA figures - the figures Ring quotes in his book are slightly different - perhaps he uses Met Office data), the yellow line the actual rainfall, and the purple line Ring's "estimates". Over the first half of the year it's clear that he gets Auckland's rainfall completely wrong. January's not too bad, but he forecasts slightly higher than average rain for February, only for there to be a virtual drought (5mm actual, Ring forecast 87mm). For March, he's suggesting nearly twice normal rainfall, but only half of average fell (Ring forecast 177, actual 55mm). In April and May, he forecast less than average rain, but nearly twice normal fell. June is not too bad, although it turns out wetter than he suggests, but in July he suggests normal rain - and only half of that fell.

If Ring was getting the flow of weather right - even if his timings were wrong - then you might expect him to get the rainfall for a region at least roughly right. He doesn't. Ken had predicted a wet late summer for Auckland. It was dry. Autumn and early winter was supposed to be dry, according to Ken. It wasn't. Of the seven months of the year to date, only January and June are roughly correct. If you were planning farming activities on the basis of his forecasts, you'd be asking for your money back.

Wellington rainfall

Ken's rainfall forecasts for Wellington are probably his most successful for the centres I looked at. For the first three months of the year his estimates are a little on the dry side, but not badly so. He suggests April will be 50% above average - it wasn't - and gets May right, but gets June and July badly wrong. His forecasts completely missed the capital's heavy rains of June and July.

Christchurch rainfall

Ken is predicting that Canterbury will have a dry year, and all his monthly estimates are below the long term average. Sadly (for him), rainfall in Christchurch was more or less average for the first four months of the year, and then significantly wetter in May and June. He could be said to have got January and March more or less right, and to have been close in July, but this has not been a dry year in Canterbury as a whole (though it is drying out a bit now - thanks to some very warm Nor'westers Ken didn't forecast).

Dunedin rainfall

Another mixed bag for Ken. He got January spectacularly wrong, predicting 162mm of rain when only 72mm (about average) actually fell. He predicted average rain for February, but only half that fell, was a bit on the dry side in March, but missed April's twice as wet as average figure. He suggested that May and July would be twice as wet as they turned out, but got June right.

So what can we make of all this? Does Ken's forecasting method show any special skill in predicting monthly rainfall in NZ's main cities? He does make some accurate forecasts - for Auckland, January and June could be said to be reasonable, for Wellington perhaps four out of the eight months are acceptable, but although he's close for three months in Christchurch, he's suggesting prolonged dryness when the outcome was wet. Dunedin's a bit like Wellington, but again he gets two or three months badly wrong. Out of 28 city/months, a generous hit rate would give him 14 - 50%. Does that show "skill"? If his forecast had simply been the long term averages for each month (that is, if his forecasts had been the blue line in the graphs), he would also have got 14 out of 28. In other words, his forecasting technique is about as useful as saying that each month will be the same as usual for the time of year. That's nowhere near his claimed 80 to 85% accuracy.

His almanac completely fails to predict the big anomalies that occurred in all four centres - Auckland's dry late summer and wet autumn and early winter, Wellington and Christchurch's wet winter, and often got the sense of the anomaly wrong - predicting drier than average conditions when it was wet, and vice versa. If his forecasting technique was actually giving a sense of the weather events as they progressed over New Zealand, then you might expect him to get the sense of the anomalies right, even if he got the total amount of rain wrong.

Next: sunshine...

Black Swan Green

David Mitchell's been getting a lot of attention in the last few years - Cloud Atlas was shortlisted for the 2004 Booker. He deserves it. I read his first three books - Ghostwritten, Number9Dream and CA - in the space of a few months. His latest, Black Swan Green, is very different to his first three, a coming-of-age story set in 1982. Through bullying, parental arguments and against the background of the Falklands war, 13 year old Jason Taylor stutters his way to inner strength. Mitchell writes beautifully, and I devoured this book in two evenings with a grin of pleasure on my face. The musical references are good - particularly enjoyed Olive's Salami by Elvis Costello and the Attractions...

Designated Targets: World War 2.2

Part Two of the Axis Of Time trilogy - an alternative history/SF series in which a fleet of 21st century warships and associated weapons turn up in the middle of WWII. Birmingham's first episode was good, and this one is just as much fun. Plenty of high (and low) tech action as the force from the future rewrites history.

The Mysterious Flame Of Queen Loana

Umberto Eco wrote the original (and much, much better) version of The Da Vinci Code (Foucault's Pendulum) and the best-selling The Name Of The Rose, both of which I enjoyed greatly. Queen Loana reads like an extended short story - an essay on memory and nostalgia, perhaps - which I'm sure resonates much more in Italy than in the anglophone world, as it deals with a man trying to recover his memory by reading the comics of his wartime youth. Eco writes well, as you might expect, and lards the text with all sorts of literary quotes and allusions - not to mention pictures from pre-war and wartime Italian comics, but ultimately the lack of overt plot and storyline makes the book feel insubstantial.

Ken Ring believes that the moon's influence on our weather is so strong that he can forecast the weather for New Zealand, Australia and the United Kingdom for years in advance, based on calculating how the moon moves in its orbit around the earth. At first glance it seems to be a bit like working out the tables that predict how tides will behave. Unfortunately for Ken, the moon's influence on the atmosphere is much, much smaller than on the sea (it's a gravity/mass thing, very well explained by Bill Keir of the Auckland Astronomical Society here). His method, as he describes it, can't work, so his forecasts must be rubbish. But are they? His books sell well enough for Random House to keep coming back for more. The popularity of Ring's almanac suggests that at least some of his readers think that his forecasts have value. Of course, astrology books also sell by the truckload…

However, what Ken does to arrive at his forecasts is irrelevant when all we want to do is to see if they work. I'm treating Ken's "lunar method" as a black box. He plugs in whatever he plugs in, and out pop the very detailed forecasts he publishes every year. I am simply going to look at what he predicted for 2006, and see how things turned out in real life.

"1. Firstly there is no claim to get every forecast right 100% of the time, but about 80-85% seems reasonable, the same as the metservices claim."

That's the accuracy Ken expects to achieve, as stated on his Appraisals and Surveys page [here]. He then lays down some conditions that - he claims in the interests of fairness - assessments of his forecasts should meet. He wants to be allowed a 24 hour error, which I take to mean a day either side of his forecast weather event. Four times a month there is a "potential skewing" of 2 to 3 days, and the summer cyclone season is apparently difficult too. Rainfall is hard, and he believes that if a rain event misses his forecast location by up to 60 miles, he should be given a "hit". With the pressure maps he prints in the almanac, he wants readers to look for "3-4 day trends" rather than an exact fit to reality. And finally, he expects that his forecasts should only be compared to other forecasts for the same day made at the same time - in other words, years in advance.

I thought about Ken's caveats very carefully. Could I do any meaningful analysis of his weather predictions and take into account all his caveats? Let's consider a forecast for rain in Christchurch on a Friday. He expects to be allowed 24 hours error, so he could claim rain on Thursday or Saturday as a success. But there are the "potential skewing" events to consider. They happen four times a month - roughly once a week - so perhaps he could claim that any rain in Christchurch on Tuesday, Wednesday, Thursday, Friday, Saturday, Sunday or Monday was confirmation of a successful forecast for rain on Friday. That's rather a lot of leeway.

I quickly realised that attempting to look at the detail of Ken's forecasts would be a thankless task. For a start, it would be a huge amount of work to take the pressure charts he prints and compare them to what actually happened. Does a Ring forecast of high pressure over the north Tasman count as successful if there's a high to the east of NZ, or if the high pops up in the right place but 3 days early or late? Too much work (I do have a life, actually), and too much wiggle room for Ring. The same applies to his daily forecasts in words - he provides two for each day. One in the "monthy summary" at the start of each month's section in the almanac, and one next to the map. Neither provide enough information for a ready measurement against reality.

There are two forecasts, however, that can be related to actual events. Ken provides summary tables of rainfall and sunshine hours for each month, and provides "estimates" of figures for 32 North Island and 25 South Island locations. Thus he predicts that Auckland will receive 79mm of rain in September, and 101 hours of sunshine. Here are figures that can be compared with actuals, and - even better - because we are dealing with whole months, the precise timing of weather events is much less important to the "skill" of the forecast. I therefore set about assembling the data for the comparison…