Ken's "estimates" for rainfall and sunshine hours appear in tables at the beginning of each month's section of the almanac. I sourced figures for the actual rainfall and sunshine hours from the National Institute for Water and Atmospheric Research's (NIWA) monthly climate summaries, available here. These are published by NIWA a week or two after the month in question, and provide a good overview of the weather we experienced - details of severe weather events, record temperatures, rainfall, snowfall etc. NIWA provide summary rainfall and sunshine figures for NZ's main centres, and I chose to use four of them for the comparison - Auckland, Wellington, Christchurch and Dunedin. I also downloaded NIWA's climate figures for rainfall and sunshine as a basis for comparison. All the data was entered into an Excel spreadsheet, available here [Excel (.xls) spreadsheet]. The current version includes data for January to July 2006, and I'll update it as subsequent months become available.
Auckland rainfall
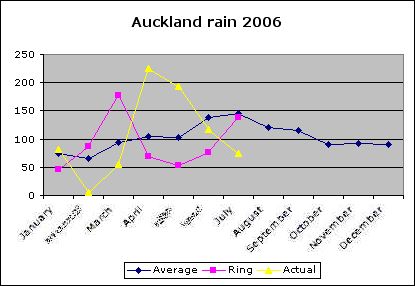
All the data for this graph (and all subsequent graphs) is available in the Excel spreadsheet linked above. The "average" is the climate data for the period 1971-2000 (NIWA figures - the figures Ring quotes in his book are slightly different - perhaps he uses Met Office data), the yellow line the actual rainfall, and the purple line Ring's "estimates". Over the first half of the year it's clear that he gets Auckland's rainfall completely wrong. January's not too bad, but he forecasts slightly higher than average rain for February, only for there to be a virtual drought (5mm actual, Ring forecast 87mm). For March, he's suggesting nearly twice normal rainfall, but only half of average fell (Ring forecast 177, actual 55mm). In April and May, he forecast less than average rain, but nearly twice normal fell. June is not too bad, although it turns out wetter than he suggests, but in July he suggests normal rain - and only half of that fell.
If Ring was getting the flow of weather right - even if his timings were wrong - then you might expect him to get the rainfall for a region at least roughly right. He doesn't. Ken had predicted a wet late summer for Auckland. It was dry. Autumn and early winter was supposed to be dry, according to Ken. It wasn't. Of the seven months of the year to date, only January and June are roughly correct. If you were planning farming activities on the basis of his forecasts, you'd be asking for your money back.
Wellington rainfall
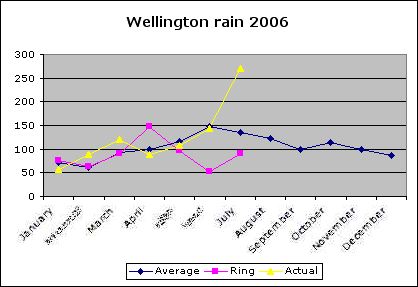
Ken's rainfall forecasts for Wellington are probably his most successful for the centres I looked at. For the first three months of the year his estimates are a little on the dry side, but not badly so. He suggests April will be 50% above average - it wasn't - and gets May right, but gets June and July badly wrong. His forecasts completely missed the capital's heavy rains of June and July.
Christchurch rainfall
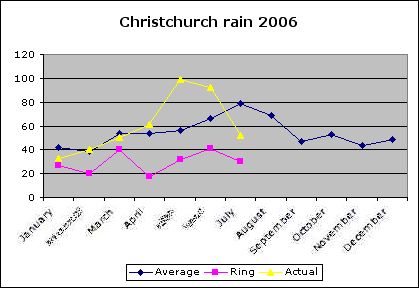
Ken is predicting that Canterbury will have a dry year, and all his monthly estimates are below the long term average. Sadly (for him), rainfall in Christchurch was more or less average for the first four months of the year, and then significantly wetter in May and June. He could be said to have got January and March more or less right, and to have been close in July, but this has not been a dry year in Canterbury as a whole (though it is drying out a bit now - thanks to some very warm Nor'westers Ken didn't forecast).
Dunedin rainfall
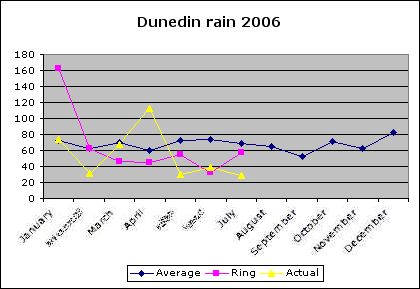
Another mixed bag for Ken. He got January spectacularly wrong, predicting 162mm of rain when only 72mm (about average) actually fell. He predicted average rain for February, but only half that fell, was a bit on the dry side in March, but missed April's twice as wet as average figure. He suggested that May and July would be twice as wet as they turned out, but got June right.
So what can we make of all this? Does Ken's forecasting method show any special skill in predicting monthly rainfall in NZ's main cities? He does make some accurate forecasts - for Auckland, January and June could be said to be reasonable, for Wellington perhaps four out of the eight months are acceptable, but although he's close for three months in Christchurch, he's suggesting prolonged dryness when the outcome was wet. Dunedin's a bit like Wellington, but again he gets two or three months badly wrong. Out of 28 city/months, a generous hit rate would give him 14 - 50%. Does that show "skill"? If his forecast had simply been the long term averages for each month (that is, if his forecasts had been the blue line in the graphs), he would also have got 14 out of 28. In other words, his forecasting technique is about as useful as saying that each month will be the same as usual for the time of year. That's nowhere near his claimed 80 to 85% accuracy.
His almanac completely fails to predict the big anomalies that occurred in all four centres - Auckland's dry late summer and wet autumn and early winter, Wellington and Christchurch's wet winter, and often got the sense of the anomaly wrong - predicting drier than average conditions when it was wet, and vice versa. If his forecasting technique was actually giving a sense of the weather events as they progressed over New Zealand, then you might expect him to get the sense of the anomalies right, even if he got the total amount of rain wrong.
Next: sunshine...
.jpg)


