Ringworld

And so, rather later than intended, we come to the end of my Ring audit. With NIWA's figures for December 2006 available, I can update my figures and finish my assessment. The final spreadsheet and all the graphs are available here. It was a "normal" month for Ken - a 50% hit rate on rainfall and sunshine in the four main centres. A forecast of the long term averages for each centre would have done better - you'd have scored 75%. If Ken's method had any merit, you might expect him to get something right - the general flow of the weather, perhaps, or the overall season. He doesn't.

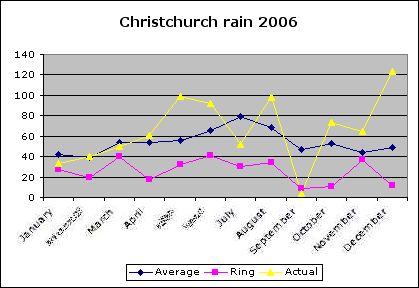
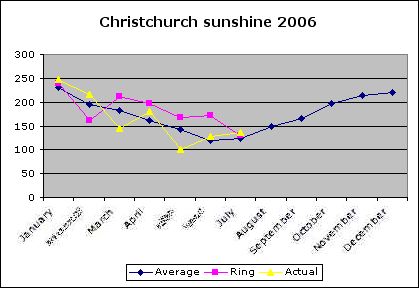
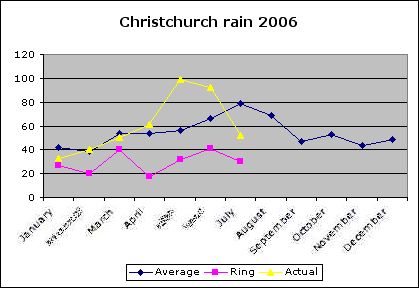
Take a look at the chart for Christchurch's rainfall for 2006. Throughout the year, Ken's been forecasting dry weather and warning of drought. In his notes for December he refers to "the prolonged exra-dry conditions in the east of the South Island" and warns that "the dry conditions in Canterbury and Otago are set to continue until May 2007". Christchurch had a wet year. Rainfall was 120% of normal, while Ken was forecasting 50%. In fact the last three months of the year were notably wet. At the time of writing, the region is an unseasonal emerald green. My neighbours are finding it hard to get enough dry days to get hay making under way, and I'm spending far too much time on my mower. In other words, Ken's forecast is "not even wrong".

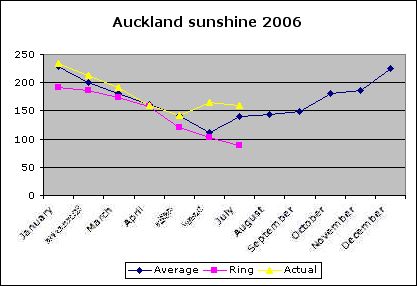
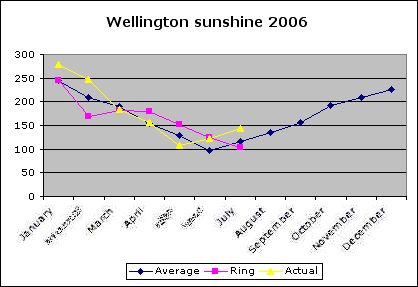
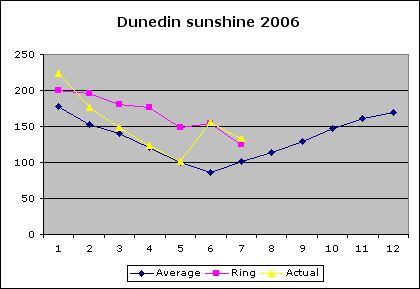
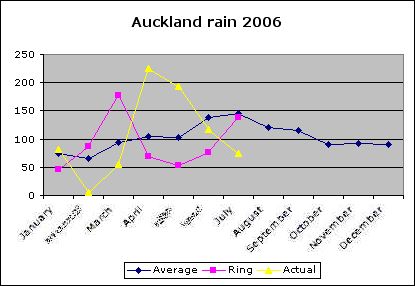
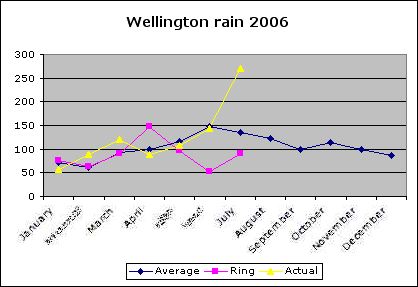
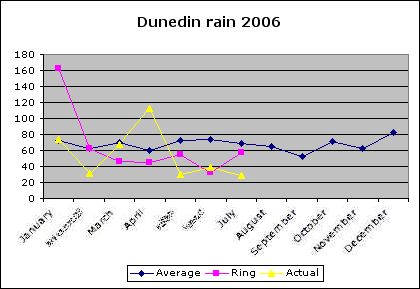
If you want to see how he did in the other centres, download my Excel spreadsheet and have a look. His "best" rainfall performance is Dunedin, which did have a dry year, but in Auckland and Wellington he didn't call a single season right. This is hardly surprising when you analyse his forecasting method. He takes the weather maps from 18 years and 10 days ago, and uses them to predict the daily weather around the country. This doesn't work. It doesn't even get close to predicting the "trends" he waffles on about, and as my little audit proves, has no merit for rainfall and sunshine forecasting. On to that "foundation" he layers stuff based on the moon's movements around the sky - which he admits is "very much astrological". This has the obvious merit of allowing him to have two goes at a forecast. He can pick and choose which ones to trumpet after the event - something he's become very skilled at.

Unfortunately, the people who buy his almanac and use it to plan their weather-related activities - the farmers, mariners and events organisers he says are devoted to his services - don't have that luxury. They need to know in advance, and Ken can't help there. So why does his book sell? How can he get away with being wrong so often, and yet still be taken seriously?

The answer is that he really believes he's right. He has so much personal mana invested in his "moon method" that he can't allow himself to see that it doesn't work. Ring's deception is self-deception, his belief in himself and his method total. He can't allow himself to admit that his method doesn't - can't - work. And with his combative personality and communication skills, he's good media fodder. The MetService forecasters are the ones conning the public, Ken Ring the lone voice in the wilderness crying sanity. It makes for good copy, for captivating soundbites.

The mystery is not why Ken is able to promote himself despite the evidence that his method is useless, it's why people buy his books. I suspect that his audience likes the idea that they are privy to an answer that the rest of the world is missing. Some people use the phases of the moon to determine their gardening schedule. It's natural for them to assume that the Ring method works. There's a parallel with dowsing for water: completely rational farmers will sometimes hire a man with a piece of bent wire to determine where they should sink a well. The evidence for dowsing is about as strong as for Ring's moon madness. Sometimes people believe six impossible things before breakfast, and then buy a Ring almanac before lunch.

My Ringworld analysis is over, but the Ringworld category will remain open for discussion of Ken's forecasts and his occasional forays into other matters. His dismissal of global warming (here) is a classic. I may return to it at a later date.

It's taken me a while to get round to it, but I have updated my comparison of Ken Ring's November rainfall and sunshine forecasts for New Zealand's four biggest cities to the actual figures, as recorded by NIWA. His rainfall forecasts are woeful. He gets Dunedin more or less right, and the other three completely wrong. On the other hand, his figures for sunshine are much better, and I can give him four "hits" there. So five out of eight for the month - slightly better than 50 percent - better than usual - but still no real evidence for forecast skill. I'll update with December's figures in January, and then post my conclusions. Regular readers may have guessed that's he's unlikely to do well. And I have to say I've missed our occasional exchanges on the NZ "Climate Science Coalition" web site, which no longer allows comments. They were swamped by automated comment spam, but seemed to think they were being picked on by Gore supporters. Says a great deal about their perspective on life...

Following on from my post about the sources of weather information that I actually find useful (as opposed to Ken's almanac, which isn't) I stumbled across MetService's "new" rural weather service. I'm not sure how new it actually is, or why it took me so long to find it, but the features it provides look excellent. I am particularly enamoured of the fact that Waipara is given its own forecast - a nifty little three day forecast generated every hour, together with a ten day outlook which is just about perfect for planning farm work. There's also a seasonal outlook, which I shall follow with interest.

The NIWA summary for October is now available, and as I've updated my spreadsheet of Ken's forecasts of rain and sun for New Zealand's four main centres against what actually happened. No surprises, really. He gets one out of four on rainfall, and three out of four on sunshine (being generous), which again puts him at 50% - way below his claimed accuracy of better than 80%.

Readers of NZ Geographic might notice that they've published a letter from me in response to the Brenstrum/Ring exchange in the previous issue. This is what I said...

"I read with great interest Ken Ring's defence of his "moon method" of weather forecasting in NZG #81. I've also been taking a look at how well Mr Ring's forecasts work, and have reached conclusions very similar to Erick Brenstrum (NZG #79). Mr Ring's almanac provides "estimates" of monthly rainfall and sunshine hours for many towns in NZ, and I have compared his forecasts for the four main centres with the actual outcomes (taken from NIWA's excellent monthly climate summaries) for the year to date. So far, he is doing no better than the easiest forecast - that rainfall in any given month will be the same as the long term average. His success rate (marked generously) is about 50%, or little better than chance. I've posted the full details on my "Ringworld" blog, which also includes details of an analysis of Ring's weather maps for 2005 by NIWA scientist Jim Renwick. Mr Ring's maps bear the same relationship to the actual weather at the time as maps selected at random from the same period in previous years. Mr Ring is a staunch defender of his forecasts. "I can prove they work about 85% of the time" he wrote in his riposte to Brenstrum's analysis in NZG #81, yet we now have three separate and independent analyses which suggest they work no better than chance. If Mr Ring is to retain any credibility as a weather forecaster, he should produce his proof, or ask his publishers to label his almanac as a work of astrology, to be placed in that section of the nation's bookshops."

Still no news from Ken about the studies that support his claim.

Over at the NZ CSC, I've been chasing Ken to provide me with details of three studies that he says support his claimed forecast accuracy. A while ago (Oct 13) he posted this:

"A prominent secondary school team did a science project that studied me for 3 months at a MOTAT exhibition sponsored by NIWA. They came up with 87%. A Massey University project gave me 85-91%. Auspacwx ran a Random Number Generator against me, and gave me above 80%. I am happy with 85% and it seems to be average. Metservice give themselves about the same most of the time."

I did some Googling and found this site, where Aussie weather follower Carl Smith took Ken's forecasts for Australia (provided by Ken to the austpacwx discussion list) and compared them to what actually happened. Carl's exhaustive effort showed that Ken was doing quite well for the first half of the month, but then the wheels fell off, and under Carl's scoring system he ended up with about 50% - more or less the same as my rainfall and sunshine analysis.

I've since been chasing Ken to provide details of the "Massey University study" in which he did so well, but he seems reluctant to provide any data. The school science fair project is similarly mysterious. Following up on Carl Smith's work, I found another exercise Carl had conducted, this time examining how well several noted astrometeorologists did on predicting the weather over the Sydney Olympics. Ken's work was included, and he was second best in show - scoring 60% on Carl's system, behind US forecaster Carolyn Egan, whose work we noted earlier [link].

To be fair to Carl (and to Ken), I should note that Carl believes there may be something to the forecast methods used by Ken, but that it needs refinement. In an email to me, copied to Ken and which Ken decided to post at the NZ CSC he said; "I do think Ken is on to something with the Moon as a factor in long range forecasting, however I also think Ken has more work to do with regards to sorting out just what contribution the Moon makes, and how and where that plays out in the real world." Carl also provided me with links to two papers (here, here)[links] by Charles Keeling & Timothy Whorf of the Scripps Institute in California, who postulate a relationship between long term lunar and solar tidal cycles and climate. Unfortunately for Ken, they explicitly rule out the mechanism he proposes drive the weather (atmospheric tides): "We focus on oceanic tides, because the atmospheric tides are too small to be of practical importance in comparison" (Keeling & Wharf, 1997).

Meanwhile, I'm still waiting for details of the Massey "study". I'll pass on the school science fair project. Having helped out with one or two of those in my time, I know how interesting they can be. But I wouldn't stake my career on the accuracy of their results.

Challenged by a poster at the NZ CSC site [item posted 30/10/06] to take me up on my offer to allow him to have guest post in Ringworld (made in that thread on Sept 29th) to "explain, on his blog, why he [Gareth] is wrong", Ken Ring replied with this astonishing little paragraph:

"He is wrong to single me out and not post up the Metservice's long range predictions as well, which is the true comparison. And in not being as vitriolic towards them for the same mistake factor and putting up a similar blog ridiculing them. He is wrong if he thinks longrange weather is a true science and can be analysed statistically, when it is a science of trends and opinions. In pretending to quantify it he is conducting a witchhunt. He is wrong to do that in a culture that allows alternative opinions. He is wrong to assume that because I make a living at something he finds disagreeable, then he is entitled to publicly undermine me."

Let's deal with his points one by one.

"He is wrong to single me out and not post up the Metservice's long range predictions as well, which is the true comparison."

It would be the correct comparison to make, if New Zealand's MetService made long range predictions. They don't. Why is that? Because they know that they don't have the tools to make meaningful predictions. NIWA, on the other hand, do make "seasonal" predictions - as does Tony Trewinnard at Blue Skies Weather - but these are attempts to put the NZ weather into an El Nino/La Nina context, expressed as (usually cautious) probability statements over the next few months. They are not in any sense detailed forecasts of expected weather events.

"And in not being as vitriolic towards them for the same mistake factor and putting up a similar blog ridiculing them."

Why would I criticise them for not doing something they never claim to do?

"He is wrong if he thinks long range weather is a true science and can be analysed statistically, when it is a science of trends and opinions."

Now we get to the nub of the issue. Ken admits that long range weather is not a "true science", and suggests that it can't be analysed statistically. While the former is certainly correct, the latter is demonstrably not. He makes, and publishes a long and detailed book containing, daily forecasts for the whole of New Zealand, including severe weather warnings, sunshine and rainfall statistics, even surf forecasts ("new for 2007"). Those forecasts can be tested against what actually happens, and we can therefore get a measure of how useful Ken's forecasts are for the buyers of his book. My analysis suggests that the "lunar method" produces forecasts that have very little "skill" - a view supported by Jim Renwick and Erick Brenstrum's separate analyses below. Think of it as a book review, where instead of criticising Ken's prose style (bombastic), we test his predictions. It's exactly analogous to a motoring magazine testing a car manufacturer's claimed performance figures. I don't know what a science of "trends and opinions" might be, but I suspect I might think it New Age nonsense.

"In pretending to quantify it he is conducting a witch hunt."

There's no pretence to my figures: they're published and downloadable. Anyone with internet access, a copy of Ken's book and a decent spreadsheet programme could do it. And is Ringworld a "witchhunt"? This is something of a meme with Ring. Earlier this month, he accused me being a Nazi and being spiteful. I view Ringworld as more of a consumer service. People who buy Ken Ring's weather "almanac" have a right to know whether his method works. And I have a right to point out that it doesn't.

"He is wrong to do that in a culture that allows alternative opinions."

I'm not stopping Ken from publishing his predictions, or promoting them. He can hold whatever opinions he likes, and publish whatever he likes, but he must not make claims that he cannot support with evidence, or that cannot be supported when tested. That's a matter of law. To let Ken get away with saying whatever he likes would be like allowing Ford to claim that their largest SUV has excellent fuel economy, when it clearly doesn't.

"He is wrong to assume that because I make a living at something he finds disagreeable, then he is entitled to publicly undermine me."

Ken is wrong to assume that he has the right to promote and sell a book claiming to offer accurate long range weather forecasts, when those forecasts are not as accurate as he claims. He cannot be above the law, even if his method is beyond science.

Earlier this year, Ken Ring did an interview with Fintan Dunne, presenter of The Next Level, a show on "Truth Radio". Ken's wit and wisdom can be listened to here (the mp3 download is linked down page) Be warned, the full interview runs for over an hour. Ken runs through his usual schtick - the moon and weather, ozone holes and global warming - and, for members of the reality-based community, there are are some wonderful laughs to be had towards the end of the show. But perhaps the funniest thing is the credulous presenter, who introduces Ken as being "imbued with special knowledge". Very special...

Important reading for Ken (and amusing reading for anyone who has followed the arguments employed by climate change deniers)... Includes a thorough debunking of the myth of tides:

"The tide myth is one of the oldest and most absurd lies that the Lunar establishment has tried to push on a gullible world. Do they really expect us to believe that the moon - an object that allegedly resides at an average distance of 240,000 miles from the earth - has the power, from that distance, to lift how many billions of cubic meters of water? Do an experiment: take a rubber ball and suspend it above a bathtub full of water. Now slowly move the ball closer to the water. Does the level of the water change? Not even slightly. So much for the tides myth. The clouds are considerably closer to the moon, and much lighter than the oceans. One would imagine that if the moon had the power to raise the oceans, this same force would cause the clouds to go flying into space, yet this does not happen. This proves that the tides story is physically impossible. Real scientists are busy researching the TRUE causes of the tides. But until their findings are made public, we can take this as merely another pseudo-scientific moon myth, shattered by the scholarship of revisionists." [here]

My weather "habit" is not as extreme as some. I don't chase thunderstorms, or obsessively photograph clouds (though I'm tempted to do more of the latter):

...but I do need to know what to expect. I have to plan farm work, irrigation and spray schedules. The usual stuff. Luckily, I don't have to worry about snow falling on lambs. Snow on beagles, that's another matter...

So what sort of forecasts are useful to me? In the most general sense, I like to keep an eye on the current state of the Southern Oscillation Index, an indicator of El Nino/La Nina conditions. When we get into a good El Nino, my part of the world is often very warm and dry, with strong norwesters taxing my patience and my trees. The weather pages at Fencepost, an NZ farm site (provided by Blue Skies Weather) have a seasonal summary that keeps an eye on the SOI (you have to register to get more than the two day forecast). At the moment we've got a weak El Nino developing:

"With clearly warmer than normal water in the equatorial Pacific there is now more solid evidence of a developing El Nino event. While this warming needs to continue for a few more months to confirm an El Nino, this seems very likely. At present the El Nino is rather weak, and there are no indications that it is likely to intensify greatly from its current levels through the rest of the year."

Tony Trewinnard at Blue Skies also provides Fencepost with a 12 day outlook, which is brief but helpful. Next stop is MetVUW, a weather site run by Victoria University in Wellington - also the home of some truly stunning weather pictures. They repackage the MetService rain radar (available every three hours), which helps me judge if and when rain is going to reach the farm. They also have forecast charts out to 7 days, using a US product. This gives me a good idea of what the general shape of the weather's going to be like over the coming week. Next stop (usually in early afternoon, when the day's forecast is posted) is the MetService Severe Weather Outlook. This forecast looks out to four or five days, suggesting where any "interesting" weather might pop up. That link also gives easy access to any severe weather or thunder warnings that may be active.

Putting all that information together gives me a pretty good mental picture of what the next week's weather is likely to be - in general, if not in particular. I can schedule which days are likely to be good for farm work - dry for mowing, calm for spraying etc - and which days might be better spent in the office. And it's all free. Ken Ring's almanac costs more than $40.

According to NIWA, September was a notably warm and dry month in much of New Zealand. The monthly summary (pdf here) notes:

"Christchurch was the driest, Dunedin the sunniest, and Auckland the wettest of the main centres. Rainfall was below normal, and temperatures above normal in all five main centres. It was extremely warm and dry for the time of year in Christchurch. Sunshine hours were near normal in Wellington, and above normal in the four other main centres, with record values in Dunedin."

Did Ken see this coming? In one respect he did - his monthly summary (p274/5) warns that September could be unusually warm, but on the other hand he also expected the month to be wetter than average.

I've updated my rainfall and sunshine spreadsheet to include the September actuals, and Ken is doing slightly better than usual. On the rainfall front, he gets Wellington, Christchurch and Dunedin more or less right - although it's worth noting that he didn't pick just how dry the last two really were - but is way off for Auckland. Sunshine is another two hits/two misses month. Overall, his batting average remains around 50% - not better than chance. His almanac doesn't predict the wet, cold weather that's rushed up the east of the country this week, so he's off to a bad start for October.

Ken is reluctant to give up his claim to have forecast the flooding in the Wairarapa in early July (see Skinhead Moonstomp below). Over at the NZ Climate Science Coalition, he posted the following (on Sept 14) when pressed to justify his claim:

"p214 For July..Districts likely to be wetter..Wanganui..north of Wairarapa.. p216..July 8th: south of Taranaki galeforce winds and more frequent showers.. p217..9th-12th..depression crosses NZ, snow central high country NI, clearing 13th. p40: flooding August 3 lower NI. Sept 12: flooding Hawkes Bay and Wairarapa. Absolutely correct. Anyone with half an honest brain will be able to work out from that that the lower NI was in for a belting, not on the east, which did remain fairly dry, but inland and central areas of the lower NI."

Let's recall, for a second, that the floods in the Wairarapa took place over July 4-6th. Apparently forecasting floods in August and September counts as a forecast for the first week in July.

Unfortunately, Ken remains in denial. On the 21st he posted:

"And I told you I predicted the heavy rain. I am rapidly losing patience with your lies. In the July column in syndicated rural magazines across the country, found in every dairy, I said: "..rain above average north of Wairarapa. Most likely rainfall times lower NI about 1st-5th and 9th-12th, heaviest 10th." That indicates plenty of rain in the first 12 days. The Metservice report of the 17 July reiterates: "The southeastern end of the North Island has been taking the brunt of the recent rain", commented MetService Weather Ambassador, Bob McDavitt.
On p42 of my almanac, for August, I wrote "in the first week very heavy rain is expected in the NI, especially Manawhatu." And in my August column, in all magazines: "lower NI could see floods." And the Metservice report of 5 Aug again reiterates: "MetService meteorologists have updated their warning for heavy rain in Northland, Auckland, Coromandel, Bay of Plenty and the Gisborne area north of Tolaga Bay as a multi-centred area of low-pressure from the subtropics continues to rapidly deepen in the north Tasman Sea. This system is forecast to move southeastwards across northern and central parts of the country on Monday, preceded by an increasing strong northeast flow containing unseasonably heavy bursts of rain. Rain on Sunday is also expected to become widespread over the rest of the north Island and northern parts of the South Island, especially to the northwest of Nelson. Places such as Wairarapa, Wellington and Wanganui with already saturated soils may get 30 to 50mm of rain."

It remains to be seen why he thinks that a forecast of rain in August is relevant to flooding in July. I pointed this out to him, only to get a most ill-tempered response.

"Take a good look at yourself and your actions. You of all people who cannot let others live and let live, who takes it upon himself to try to ruin the credibility and business of another just because he doesn't like the other's ideas and theories. You cannot claim I have tried to affect your business, but there is every piece of evidence on your nasty little blog to prove you are out to wreck mine. You are a Nazi, Gareth, and no less. You are displaying the very root of the type of scapegoatism that lead to the Holocaust."

Erick Brenstrum is a bully for daring to analyse Ring's almanac's forecasts, and I am a Nazi. If it wasn't risible, it would be an insult, and Ken would be in court. In the meantime, we have to conclude that his judgement of the success of his forecasts is no better than wishful thinking.

This is by way of being a "guest blog". Following on from Erik Brenstrum's sterling efforts at analysing Ken Ring's work, we have the work of one of NIWA's senior scientists, Jim Renwick, who for his own interest (and in his own time) looked at the maps in Ken's almanac for 2005 and compared them with reality:

"Since I have all the maps for the last 40 years in electronic form, it was easy for me to score his daily weather maps against reality for all of last year. His scores were slightly worse than those obtained by picking maps at random. Allowing him one day's grace (i.e. choosing the best score from verifying against yesterday, today, and tomorrow's actual outcome) made things slightly better, but still didn't beat the random forecast when it was also given one day's grace."
"The first uses what are called by forecasters "S1 scores". They are a measure of the relative error in the forecast pressure map (actually the errors in the pressure differences, or implied winds), as a percentage. So, they are like golf scores, the lower the better, with zero being absolutely perfect. In practice, a score of less than 30 is considered so good as to be almost perfect for forecasting purposes. A score of more than 80 is considered useless for forecasting the actual weather.
Each set of results is shown as a box plot, where the red line shows the median of the daily scores, the box extent shows the range of scores from the 25 percentile to the 75 percentile (i.e. the range that the middle 50% of the scores lie within) and the "error bars" show the 95% interval. Any red plus signs are "outliers" beyond the "error bar" limits.
I have scored the Moon forecasts (labelled "K Ring") and compared with various other methods. The first is with forecast maps chosen at random from the past 40 years (labelled "Random") - they are selected to be within 10 days of the DATE we're interested in, but can be from any year. This is to match Ken's 18yr+10day offset, and keeps the seasonality OK. Then, I allow the moon forecasts 1 day's grace either side ("Ring+1") and the same for random ("Rand+1"). I also calculated scores for "climatology" i.e. using the average maps for the time of year (labelled "Climat"), and for "persistence", i.e. using yesterday's map as the forecast for today (labelled "Persis"). Finally, I obtained the MetService's two-day-ahead forecasts for the year of 2005 and scored those, as in the last column labelled "Met 2d".
You can see that the Moon forecasts have a median score about 85 (useless). About two thirds of the moon forecasts score over 80, in the "useless" category, and about 1% are in the less than 30 "perfect" category. The random forecasts do about the same - identically in a statistical sense. If we allow one day's grace, both sets of scores improve about the same amount, so now only one third are useless and 2% are perfect. The climatology forecasts are in between the straight moon forecasts and the 1-day's-grace moon forecasts. Persistence is way better, with almost no "useless" forecasts. The best by far are the Met Service two-day forecasts (and one-day ones are better again, of course), where only two of the 365 forecasts are "useless" (about 1%) and about two thirds are "perfect", the reverse of the moon forecast situation."

Thanks Jim!

In other words, the weather maps in Ken's almanac for 2005 were - as tools for weather forecasting - statistically identical with maps selected at random from the same time of year over the last 40 years. Give him "the day either side" he claims to need, and his work is still no better than picking maps at random. A picture is beginning to emerge. From my analysis of rainfall and sunshine, from Erick Brenstrum's analysis of his forecasts and Jim Renwick's scoring of his weather maps, Ken's system of weather forecasting does no better than random guesswork. Even the easiest forecast in the world - tomorrow will be like today - does better than the Ring method.

I wonder how he calculates his "80% success rate"?

Ken Ring's "forecasts" have been subjected to some serious scrutiny beyond my own modest efforts. Erick Brenstrum of MetService (author of the excellent New Zealand Weather Book) writes regularly for NZ Geographic, and used his column in the May-June issue this year (#79) to look at how Ken's forecasts for 2005 performed. The piece is not available on the web, but Erick was kind enough to send me a copy, together with a letter from Ring and Erick's reply from the current issue (#81). It's a fascinating read...

Erick reveals that the weather maps that Ken prints in his almanac are those for 18 years and 10 days prior to the day in question. There is, I presume, a "lunar" reason for this. Ken has quite a few to play with...

"Weather maps will be seen to repeat on a simpler time frame, and I have used 6584 lunar days, 6726 lunar days and 6935 solar days in past almanacs. These cover 18-20 years. Anyone wishing to explore the cycles operating on their location should experiment with old rainfall or temperature data, finding a stand-out event and then checking back through their own records to find a matching standout event between 18-20 years ago. The cycle that emerges can then be used to project into the future. What works for one location will not necessarily work for another."

That may explain why they don't work at all. Erick analyses a number of common NZ weather systems - strong northwest winds preceding a front that brings heavy rain to the west coast, and lows that cross the country bringing rain to the east coast. In 2005 there were 22 of the former - none matched in Ken's maps - and 18 of the latter, of which Ken's map sequence got precisely one. Giving him his one day either side leeway doesn't make much difference.

Ken wasn't impressed with Erick's deconstruction of his forecasts. From NZ Geographic issue 81:

"Despite what he says, I can prove they work 85 per cent of the time."

And then, in what seems to be something of a meme for Ken, he accuses Brenstrum of bullying him by naming him. As Warren Judd, editor of NZ Geographic comments:

"...once you publish a book, you're fair game for public scrutiny of its content and your own competence."

I'm waiting for Ken to supply his proof of competence. I've been looking. I can't find it.

PS: Warren, could you put Erick's columns up on your site? It would be a service of national importance...

NIWA's climate summary for August is now available, and I've updated my spreadsheet (here). On both rainfall and sunshine, Ring gets two hits and two misses, so his city/month hit rate is still running at about 50%. Forecasting the long-term average would have done better than the moon method in August. I'll update the graphs and trends when we have another couple of months data, and do a roundup at the end of the year.

Meanwhile, over at the NZ Climate Science Coalition, Ken makes a telling admission:

"Okay, my work is very much astrological, which is the same as saying meteorological, because the astrologers invented meteorology. So does that mean now you'll leave it alone? I suspect not. It takes more than that to stop a playground bully."

I'm sure the notion that meteorology was invented by astrologers will come as news to historians of science. He seems to think that making any attempt to audit his forecasts amounts to bullying. Facing the facts can sometimes be difficult, but I don't think it amounts to bullying. And he admits, grudgingly, that his work is "astrological". But I don't expect to find that admission on his new almanac...

As I noted a couple of days ago, Ken is making some claims for this year's forecasts in his Ezine for Sept 3:

"We were quite happy to have gotten most events correct for the 2006 version. p41 lists 12 June "cold wintry blast brings snow to low levels in Canterbury..". We also got the timing of the formation of Cyclones Larry/Wati and Monica, the flooding in the Wairarapa, the good snow amounts at Whakapapa and the low levels in the southern hydrolakes."

Let's take a look at "the flooding in the Wairarapa" which he claims to have "gotten" correct. Over the three days from July 4th to 6th, the Wairarapa was wet. From the NIWA climate summary for July:

"High rainfall totalling 100 to 160 mm or more over 3-days occurred throughout Wairarapa, Wanganui, and Wellington during 4-6 July. This resulted in high rivers and severe surface flooding throughout much of southern Wairarapa, along with substantial landslips in parts of the Wanganui and Wellington regions. 100 mm was reported within 24 hours in parts of South Wairarapa, where people had to be evacuated from their homes. Martinborough was isolated by the floodwaters, and surface flooding also affected Greytown and Carterton. In Wairarapa, more than 50 roads were closed due to flooding or landslips."

I looked through Ring's almanac to see if I could find his successful prediction of these dramatic events. I started at the front. On p34 he gives his "season estimates". Nothing there. On p41, he gives his extreme weather warnings. Nothing there either. I flipped through to the chapter for July. The summary on p214 doesn't mention floods or heavy rain in the Wairarapa, and the daily summaries don't either. A bit further on (p227/8), his daily charts don't look anything like the weather charts for the period. He forecasts "showers in the north and east of of the North Island for the 4th, then it's fine and dry right through to July 8th. In early July, the only reference to any serious weather is in the summary for July 8th, where he mentions "gale force winds and more frequent showers" south of Taranaki. That paragraph also includes "in the east from Gisborne to the Wairarapa, dry with strong westerlies". There's nothing in his Ezine for the period either.

Try as I might, I could find no reference to heavy rain in the region within a week either side of the actual event. So how does Ring reckon he correctly forecast the Wairarapa floods? I don't know... Perhaps he'll tell us. In the meantime, I am forced to conclude that he is misleading us. I'm sure that this is not deliberate, and that he will correct his statement promptly. I'll be sure to provide an update when he does.

I'm not ploughing a lonely furrow in my examination of Ring's "forecasting". Apart from Bill Keir's dissection of the moon method, I've come across a couple of other web pages that put his forecasts under the microscope. I See Dumb People, an NZ site devoted to exposing scams, has an interesting page on Kenny and his forecasts. They're very strong on his ability to conjure accurate forecasts out of the most unpromising material in his almanac. And an Australian site, Second Sight, isn't too impressed with Ken either.

But Ken's not on his own, either. I've discovered that there are a few people who call themselves astrometeorologists who believe that the moon and stars can be a useful predictive tool. Here's an American example, WeatherSage, (there's a blog, too). And guess what? Ms WeatherSage has page of tributes to astrometeorologists - including Ken Ring. It's a small moon...

From Ken Ring's Weather Ezine (Sept 3rd):

Sydney notes

September

Two weeks of dry weather with possible fogs to begin with. ... All in all, a nice month, no huge storms, no cyclones, good spring weather.

Daily:

September 4 Mon Partly cloudy, fine, warmer

September 5 Tue Fine, moderate breezes, fog potential

September 6 Wed Fine, mostly sunny, fog potential

September 7 Thu Fine, sunny

September 8 Fri Mainly fine, misty/fog patches

September 9 Sat Mainly fine, lowland fog patches possible, lazy winds

September 10 Sun Cloudy, threatening rain, mostly dry

From ABC News, September 7th:

Drenched Sydney braces for high winds

Wind gusts up to 95 kilometres an hour are expected to hit Sydney later today after a night of wild weather. Heavy rain and localised flash flooding has caused commuter chaos across the Sydney metropolitan area. A mudslide north of Wollongong has forced the closure of the south coast rail line between Scarborough and Waterfall....

The Bureau of Meteorology says 107 millimetres of rain has fallen in Sydney - the third-highest September daily rainfall total in history, and the highest since 1883. In the catchment area, Warragamba has received 47 millimetres of rain.

Another striking success for the Ring method.

[Apologies to anyone who's tried to download the spreadsheet - there was an issue with my file upload. Fixed now.]

The long term averages for monthly sunshine hours show an unsurprising pattern: highest in December/January, lowest in June. There aren't the big positive variances from the mean that we see in rainfall because there is a maximum limit - the day length. On the other hand, it's conceivable that a very cloudy month could have very low - even zero - hours of sunshine, but that would be much more likely (or easily achieved) in winter when days are shorter.

Auckland

Actual sunshine hours track the long term average through until June, which was much sunnier than normal. Ring's "estimates" are low in January, then follow the average through until June - which he therefore gets wrong. He also forecasts that July would be significantly duller than average, but it turned out to be sunnier.

Wellington

Ring's forecasts for the capital are right twice, in March and June. He gets February very wrong, and May and July are only slightly better.

Christchurch

Ring does well in January and July, and not badly in April, but the other months are all well wide of the mark. Since he reckons Christchurch is supposed to be drier than normal, that could explain why he predicted more sun than average from March through to July.

Dunedin

I was surprised to discover that Dunedin only averages 86 hours of sunshine in June (under 3 hours per day). Perhaps that's why the students there seem so fixated on burning sofas in the streets. Heat and light...

Ken is clearly convinced that Dunedin should be having a sunny year. He does well in June and July, and not too badly in January, but as the rest of the year tracks the long term average, he's way out.

So how many city/months can we give him? Being generous, I score him with four hits in Auckland, Wellington and Dunedin and three in Christchurch, for a total of 15 out of 28 - or about 54%. If he had simply predicted the long term average, he'd have been right four times in Wellington and Dunedin, five times in Christchurch, and six in Auckland for a total of 19, or 68%.

Ken's rain and sun forecasts are therefore "right" (or "close enough") about half the time, which is no better - and sometimes worse - than simply predicting that rain or sun in a given location will simply be the same as the long term average for that time. This is hardly a ringing endorsement of Ken's forecasting method, and certainly a long way short of the 80% to 85% accuracy he claims.

Next: how good is Ken at forecasting newsworthy weather events? He claims (Weather Ezine, Sept 3):

"We were quite happy to have gotten most events correct for the 2006 version. p41 lists 12 June "cold wintry blast brings snow to low levels in Canterbury..". We also got the timing of the formation of Cyclones Larry/Wati and Monica, the flooding in the Wairarapa, the good snow amounts at Whakapapa and the low levels in the southern hydrolakes."

Most events? More than half? The flooding in the Wairarapa? Digging into that will provide an interesting perspective on his forecast techniques...

Ken's "estimates" for rainfall and sunshine hours appear in tables at the beginning of each month's section of the almanac. I sourced figures for the actual rainfall and sunshine hours from the National Institute for Water and Atmospheric Research's (NIWA) monthly climate summaries, available here. These are published by NIWA a week or two after the month in question, and provide a good overview of the weather we experienced - details of severe weather events, record temperatures, rainfall, snowfall etc. NIWA provide summary rainfall and sunshine figures for NZ's main centres, and I chose to use four of them for the comparison - Auckland, Wellington, Christchurch and Dunedin. I also downloaded NIWA's climate figures for rainfall and sunshine as a basis for comparison. All the data was entered into an Excel spreadsheet, available here [Excel (.xls) spreadsheet]. The current version includes data for January to July 2006, and I'll update it as subsequent months become available.

Auckland rainfall

All the data for this graph (and all subsequent graphs) is available in the Excel spreadsheet linked above. The "average" is the climate data for the period 1971-2000 (NIWA figures - the figures Ring quotes in his book are slightly different - perhaps he uses Met Office data), the yellow line the actual rainfall, and the purple line Ring's "estimates". Over the first half of the year it's clear that he gets Auckland's rainfall completely wrong. January's not too bad, but he forecasts slightly higher than average rain for February, only for there to be a virtual drought (5mm actual, Ring forecast 87mm). For March, he's suggesting nearly twice normal rainfall, but only half of average fell (Ring forecast 177, actual 55mm). In April and May, he forecast less than average rain, but nearly twice normal fell. June is not too bad, although it turns out wetter than he suggests, but in July he suggests normal rain - and only half of that fell.

If Ring was getting the flow of weather right - even if his timings were wrong - then you might expect him to get the rainfall for a region at least roughly right. He doesn't. Ken had predicted a wet late summer for Auckland. It was dry. Autumn and early winter was supposed to be dry, according to Ken. It wasn't. Of the seven months of the year to date, only January and June are roughly correct. If you were planning farming activities on the basis of his forecasts, you'd be asking for your money back.

Wellington rainfall

Ken's rainfall forecasts for Wellington are probably his most successful for the centres I looked at. For the first three months of the year his estimates are a little on the dry side, but not badly so. He suggests April will be 50% above average - it wasn't - and gets May right, but gets June and July badly wrong. His forecasts completely missed the capital's heavy rains of June and July.

Christchurch rainfall

Ken is predicting that Canterbury will have a dry year, and all his monthly estimates are below the long term average. Sadly (for him), rainfall in Christchurch was more or less average for the first four months of the year, and then significantly wetter in May and June. He could be said to have got January and March more or less right, and to have been close in July, but this has not been a dry year in Canterbury as a whole (though it is drying out a bit now - thanks to some very warm Nor'westers Ken didn't forecast).

Dunedin rainfall

Another mixed bag for Ken. He got January spectacularly wrong, predicting 162mm of rain when only 72mm (about average) actually fell. He predicted average rain for February, but only half that fell, was a bit on the dry side in March, but missed April's twice as wet as average figure. He suggested that May and July would be twice as wet as they turned out, but got June right.

So what can we make of all this? Does Ken's forecasting method show any special skill in predicting monthly rainfall in NZ's main cities? He does make some accurate forecasts - for Auckland, January and June could be said to be reasonable, for Wellington perhaps four out of the eight months are acceptable, but although he's close for three months in Christchurch, he's suggesting prolonged dryness when the outcome was wet. Dunedin's a bit like Wellington, but again he gets two or three months badly wrong. Out of 28 city/months, a generous hit rate would give him 14 - 50%. Does that show "skill"? If his forecast had simply been the long term averages for each month (that is, if his forecasts had been the blue line in the graphs), he would also have got 14 out of 28. In other words, his forecasting technique is about as useful as saying that each month will be the same as usual for the time of year. That's nowhere near his claimed 80 to 85% accuracy.

His almanac completely fails to predict the big anomalies that occurred in all four centres - Auckland's dry late summer and wet autumn and early winter, Wellington and Christchurch's wet winter, and often got the sense of the anomaly wrong - predicting drier than average conditions when it was wet, and vice versa. If his forecasting technique was actually giving a sense of the weather events as they progressed over New Zealand, then you might expect him to get the sense of the anomalies right, even if he got the total amount of rain wrong.

Next: sunshine...

Ken Ring believes that the moon's influence on our weather is so strong that he can forecast the weather for New Zealand, Australia and the United Kingdom for years in advance, based on calculating how the moon moves in its orbit around the earth. At first glance it seems to be a bit like working out the tables that predict how tides will behave. Unfortunately for Ken, the moon's influence on the atmosphere is much, much smaller than on the sea (it's a gravity/mass thing, very well explained by Bill Keir of the Auckland Astronomical Society here). His method, as he describes it, can't work, so his forecasts must be rubbish. But are they? His books sell well enough for Random House to keep coming back for more. The popularity of Ring's almanac suggests that at least some of his readers think that his forecasts have value. Of course, astrology books also sell by the truckload…

However, what Ken does to arrive at his forecasts is irrelevant when all we want to do is to see if they work. I'm treating Ken's "lunar method" as a black box. He plugs in whatever he plugs in, and out pop the very detailed forecasts he publishes every year. I am simply going to look at what he predicted for 2006, and see how things turned out in real life.

"1. Firstly there is no claim to get every forecast right 100% of the time, but about 80-85% seems reasonable, the same as the metservices claim."

That's the accuracy Ken expects to achieve, as stated on his Appraisals and Surveys page [here]. He then lays down some conditions that - he claims in the interests of fairness - assessments of his forecasts should meet. He wants to be allowed a 24 hour error, which I take to mean a day either side of his forecast weather event. Four times a month there is a "potential skewing" of 2 to 3 days, and the summer cyclone season is apparently difficult too. Rainfall is hard, and he believes that if a rain event misses his forecast location by up to 60 miles, he should be given a "hit". With the pressure maps he prints in the almanac, he wants readers to look for "3-4 day trends" rather than an exact fit to reality. And finally, he expects that his forecasts should only be compared to other forecasts for the same day made at the same time - in other words, years in advance.

I thought about Ken's caveats very carefully. Could I do any meaningful analysis of his weather predictions and take into account all his caveats? Let's consider a forecast for rain in Christchurch on a Friday. He expects to be allowed 24 hours error, so he could claim rain on Thursday or Saturday as a success. But there are the "potential skewing" events to consider. They happen four times a month - roughly once a week - so perhaps he could claim that any rain in Christchurch on Tuesday, Wednesday, Thursday, Friday, Saturday, Sunday or Monday was confirmation of a successful forecast for rain on Friday. That's rather a lot of leeway.

I quickly realised that attempting to look at the detail of Ken's forecasts would be a thankless task. For a start, it would be a huge amount of work to take the pressure charts he prints and compare them to what actually happened. Does a Ring forecast of high pressure over the north Tasman count as successful if there's a high to the east of NZ, or if the high pops up in the right place but 3 days early or late? Too much work (I do have a life, actually), and too much wiggle room for Ring. The same applies to his daily forecasts in words - he provides two for each day. One in the "monthy summary" at the start of each month's section in the almanac, and one next to the map. Neither provide enough information for a ready measurement against reality.

There are two forecasts, however, that can be related to actual events. Ken provides summary tables of rainfall and sunshine hours for each month, and provides "estimates" of figures for 32 North Island and 25 South Island locations. Thus he predicts that Auckland will receive 79mm of rain in September, and 101 hours of sunshine. Here are figures that can be compared with actuals, and - even better - because we are dealing with whole months, the precise timing of weather events is much less important to the "skill" of the forecast. I therefore set about assembling the data for the comparison…

Over the last few months, I've been a regular visitor at the web site of the NZ Climate Science Coalition, a loose affiliation of local global warming deniers who are trying (rather desperately) to influence the public debate about policy responses to climate change. I don't want to go on about them at great length here, but I have been spending time debating and debunking some of their more outrageous misrepresentations (I'm being polite) of the science of the issue. Suffice to say they don't like the Kyoto Protocol...

One man has been particularly vociferous in those debates - the "long range weather forecaster" Ken Ring. He believes that the Moon and its movements allow him to predict New Zealand's weather years in advance. Random House publish Ring's forecasts in a thick ring-bound almanac - the 2007 almanac is due out in September (and this year, there's an Australian version). Ken is an aggressive debater - and denier - of global warming, but his grasp of the subject is rather idiosyncratic (I'm being polite again). You can find some of his views if you track back through this thread at the NZ CSC site, or get added perspective at Tim Lambert's excellent Deltoid blog.

And so, in the course of dispute, I found myself undertaking to "audit" Ken's forecasts. Not quite a climate audit, perhaps (not a hockey stick in sight), but an attempt to see if his published forecasts have any skill (ie, are they useful). Ring isn't shy about claiming successes - after all, public profile helps to sell books (as I know) - but is there any real merit in his method? Has the world of weather and climate forecasting overlooked a real breakthrough?

I have therefore created a new Ringworld topic (see sidebar), and over the next couple of weeks I'll be posting the first results of my review of Ring's forecasts for the year to date. The posts won't appear on the front page (if I can work out how to do that in Tinderbox...). Ordinary truffle and farm posts shouldn't be affected too much.